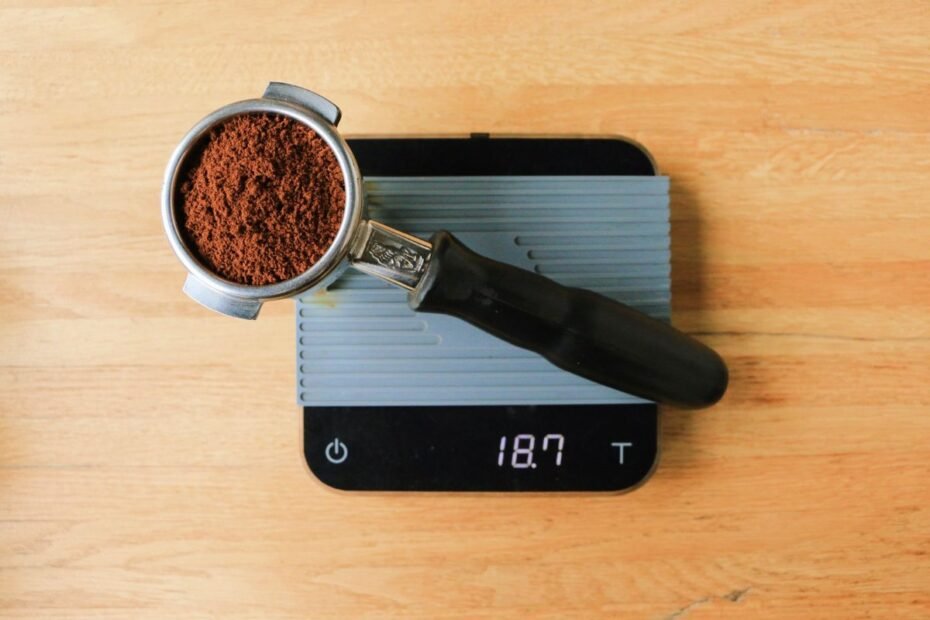
A coffee-to-water ratio is the weight of ground coffee compared with the weight of water. At 1:16, for example, you use 1 gram of coffee for every 16 grams of water. Most filter and immersion recipes fall between 1:15 and 1:18; espresso and cold brew concentrate use very different numbers because they are measured differently.
The ratio is the main control you have over strength: how concentrated the cup is. It does much less to fix sourness or bitterness, which come mainly from extraction. Below are starting ratios by method, a quick calculation table, and what research on coffee drinkers says about choosing between a stronger and a lighter cup.
Starting Ratios by Brewing Method
| Method | Starting ratio | Example |
|---|---|---|
| Pour-over | 1:15–1:17 | 20 g coffee + 300–340 g water |
| French press | 1:15–1:17 | 30 g coffee + 450–510 g water |
| Drip coffee maker | 1:16–1:18 | 30 g coffee + 480–540 g water |
| Cold brew concentrate | 1:5–1:7 | 100 g coffee + 500–700 g water, diluted before drinking |
| Cold brew, ready to drink | 1:8–1:10 | 100 g coffee + 800–1,000 g water |
| Espresso | About 1:2 (coffee to finished drink) | 18 g coffee → about 36 g espresso |
| Moka pot | Set by the pot | Fill the basket and the water chamber as designed |
These ranges are common recipe conventions rather than measured optimums, and roasters and equipment makers publish recipes on either side of them. Start in the middle of the range for your method and move from there.
How to Calculate Any Ratio
The formula is: coffee weight × ratio number = water weight. To work backward, water weight ÷ ratio number = coffee weight. Because 1 ml of water weighs about 1 g, you can read millilitres and grams interchangeably for water.
- 24 g of coffee at 1:16 → 24 × 16 = 384 g of water.
- 500 g of water at 1:16 → 500 ÷ 16 = 31.25, so about 31 g of coffee.
Or use the table below, which already does the division:
| Water | Coffee at 1:15 | Coffee at 1:16 | Coffee at 1:17 |
|---|---|---|---|
| 250 g (one mug) | 17 g | 16 g | 15 g |
| 350 g | 23 g | 22 g | 21 g |
| 500 g | 33 g | 31 g | 29 g |
| 750 g | 50 g | 47 g | 44 g |
| 1,000 g (1 liter) | 67 g | 62.5 g | 59 g |
A lower second number means a stronger cup: 1:15 uses more coffee per gram of water than 1:17. To make more or less coffee, keep the ratio and scale both amounts together.
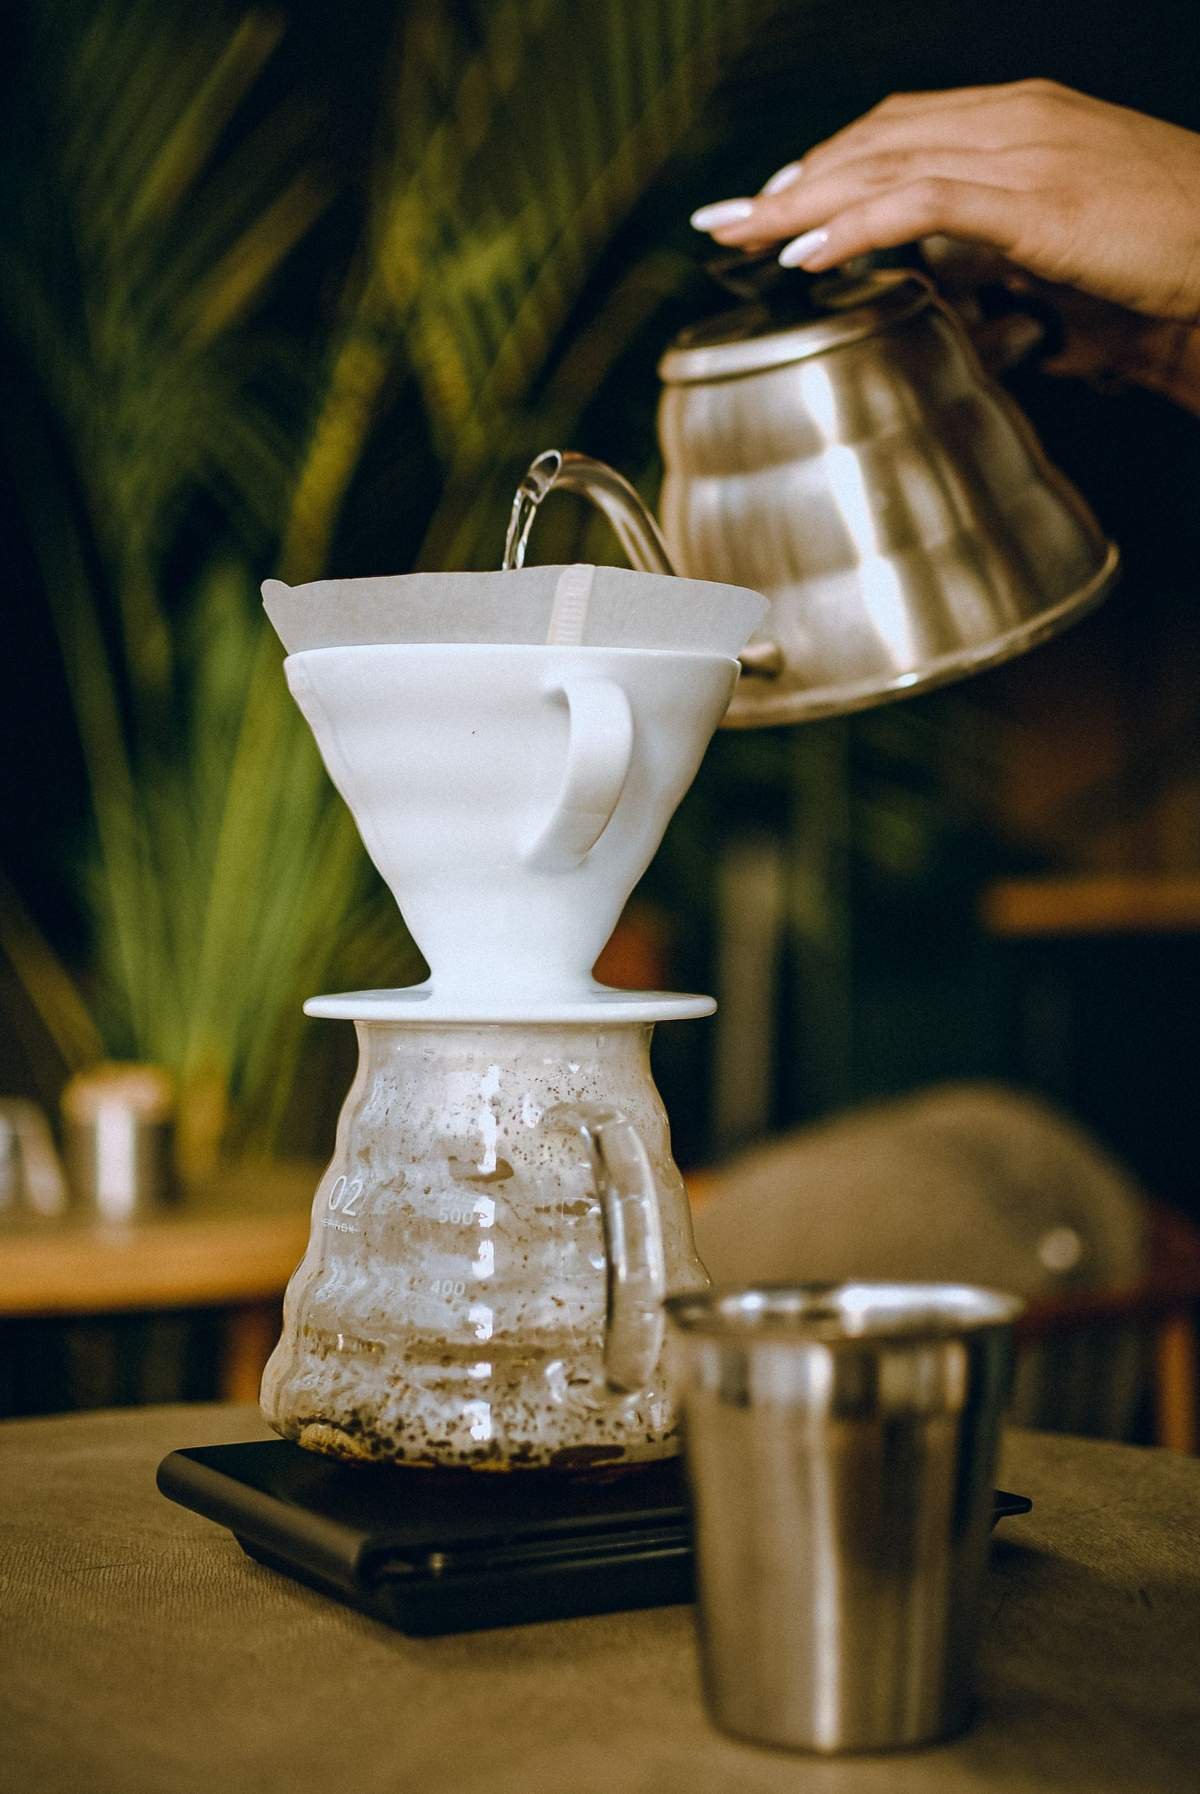
Weighing is what makes a ratio repeatable, because a spoonful of coffee can hold a different weight depending on the beans and the grind. Our guide to whether you need a coffee scale covers how to weigh without fancy equipment.
Brew Ratio vs. Beverage Ratio
Two different kinds of ratio are in common use, and mixing them up is a frequent source of confusion.
- Brew ratio (pour-over, drip, French press, cold brew) compares coffee with the water you put in. Some of that water stays in the wet grounds, so the cup you drink weighs less than the water you poured.
- Beverage ratio (espresso) compares coffee with the liquid that ends up in the cup. An 18 g dose producing 36 g of espresso is 1:2. That is why espresso numbers look so different from filter numbers.
Cold brew concentrate needs one more step: the ratio that matters for taste is the final one after dilution. A 1:5 concentrate (100 g coffee, 500 g water) diluted with an equal amount of water, 500 g, has used 1,000 g of water in total, which puts it in the same range as ready-to-drink cold brew at 1:10. See our cold brew guide for the full method.
Is There a “Correct” Strength?
Coffee professionals have long used a brewing control chart, first developed by Ernest Earl Lockhart in the 1950s, that plots strength against extraction and shows brew ratios as diagonal lines. The chart marks a central “ideal” zone. Researchers at the University of California, Davis, have since tested how well that idea fits real drinkers.
In a study published in the Journal of Food Science in 2021, 118 consumers tasted 27 black coffees brewed to different strengths and extraction levels, in more than 3,000 tastings. The consumers did not share a single preference: they split into two groups, and the groups differed mostly by strength. One group liked more intense coffee; the other preferred a more subtle cup and disliked high acidity and bitterness.
The practical takeaway is that there is no single correct ratio to aim for. Strength is largely a matter of personal preference, and the ratio is the most direct way to set it.
Adjusting the Ratio by Taste
| The coffee tastes | What to change first |
|---|---|
| Too strong or heavy | More water or less coffee (for example, 1:15 → 1:17) |
| Too weak or watery | Less water or more coffee (for example, 1:17 → 1:15) |
| Sour or sharp | Grind finer or brew longer before touching the ratio |
| Bitter or harsh | Grind coarser or shorten the brew before touching the ratio |
Sourness and bitterness are usually extraction problems. Changing the ratio dilutes or concentrates them, but does not remove them. See bitter vs. sour coffee and why grind size matters for those fixes. The same ratio can also taste different with a different coffee, so expect small adjustments when you change beans.
Method Notes
- Pour-over: because you control the pour, it is easy to try 1:15, 1:16, and 1:17 on consecutive days with the same dose. See the V60 guide.
- French press: the grounds steep for several minutes; if you like a heavier, more concentrated cup, move toward 1:15. See the French press guide.
- Drip machines: the easiest variable to change is the coffee dose, since the water reservoir is usually filled to the same mark. Check the manufacturer’s recommended dose as well. We compare drip with manual brewing in drip coffee maker vs. pour-over.
- Moka pot: the basket and the lower chamber are sized to work together, so fill the lower chamber as the manufacturer instructs and fill the basket level without pressing it down. Changing the ratio is not really practical; to make less coffee, use a smaller pot. See the moka pot guide.
- Espresso: 1:2 is a common starting point. Shorter ratios such as 1:1.5 give a thicker, more concentrated shot, and longer ones such as 1:3 a lighter one.
Sources
- Frost, S., Batali, M., Guinard, J.-X., and Ristenpart, W. D. Towards a New Brewing Chart. 25 magazine, Specialty Coffee Association. Source for the description of Lockhart’s brewing control chart and how brew ratio appears on it.
- UC Davis Coffee Center. Publications, entry for Cotter, Ristenpart, and Guinard (2021), “Consumer preferences for black coffee are spread over a wide range of brew strengths and extraction yields,” Journal of Food Science. Source for the study size and the two consumer groups that differed mainly by strength.
- Cotter, A. R., et al. Conference poster, ASIC 2021. Source for the description of the two preference groups (intense versus subtle).
